Reading Time: 10 mins
Overview
Nagios, free and open-source software is used for continuous monitoring of system metrics, applications, network elements, server resources and custom services. It works by providing two major services, namely; monitoring service and alerting service. It is available in two different interfaces such as Nagios Core (which is open-source) and Nagios XI (which is a freemium as hosting (nodes) is limited to seven).
The Nagios XI is further available in two different editions called Standard Edition and Enterprise Edition. The NRPE (Nagios Remote Plugin Executor) is used as an intermediate agent to connect with the remote hosts by Nagios.
Pre-conditions
- Web Server: Apache 2.x
- Programming Language: PHP 7.2
- Requires firewall configuration tool, ufw (since we use Ubuntu).
- Presuming that you are logged in as a non-root user (in which sudo privileges is necessary).
- Not installed Apache yet, go to, Installing and Setting Virtual Hosts for Apache on Ubuntu 18.04
- In case you didn’t install PHP on your Ubuntu, visit, Installing PHP On Ubuntu 18.04
Here, we use two servers. One will be used as a Nagios’ server and the other one will be used as our web server. It is also to be noted that it is best if you install Nagios on a separate server as it is troublesome to monitor several remote hosts in a single server. Only in the case of monitoring a single website, it is recommended to go with the same server.
Table of Contents:
- Overview
- Installing Nagios Core
- Installing Nagios Plug-ins
- Installation of check_nrpe Plug-in
- Configuring Nagios
- Testing Nagios
- Installation of NRPE daemon with its Prerequisites
- Installation of Nagios Plug-ins
- Installation of NRPE daemon
- Monitoring Configuration with Nagios Server
- Conclusion
Installing Nagios Core
Step 1: Updating the Packages
Log in to your Nagios server and do make sure that you have installed all the required packages. Though there are numerous ways possible to install Nagios, let us stick with the trusted way of installing Nagios, i.e from its official website as it comes with updated versions and security patches.
Before start installing Nagios Core, you need to install some of the required libraries.
To update the default packages,
sudo apt-get update
To install libraries,
sudo apt install autoconf gcc make unzip libgd-dev libmcrypt-dev libssl-dev dc snmp libnet-snmp-perl gettext
Step 2: Installing Nagios
Install Nagios using the curl command and make sure you are in a home directory (as it is easy to identify the required packages when it is configured in the home directory).
curl -L -O https://github.com/NagiosEnterprises/nagioscore/archive/nagios-4.4.5.tar.gz
Note: To confirm that you have installed the latest version of Nagios, go to the Nagios official website, https://www.nagios.org/downloads/nagios-core/thanks/?skip=1/
Step 3: Configuring Nagios with Apache
Extract the Nagios file which we downloaded in the previous step.
tar zxf nagios-4.4.5.tar.gz
Now, enter the extracted directory with the below command,
cd nagioscore-nagios-4.4.5
Next, to configure Nagios, enable Apache configuration with the below command:
./configure --with-httpd-conf=/etc/apache2/sites-enabled
Post which, you will see an output like the below one,
Output
*** Configuration summary for nagios 4.4.5 2019-07-29 ***:
 General Options:
 -------------------------
        Nagios executable:  nagios
        Nagios user/group:  nagios,nagios
       Command user/group:  nagios,nagios
             Event Broker:  yes
        Install ${prefix}:  /usr/local/nagios
    Install ${includedir}:  /usr/local/nagios/include/nagios
                Lock file:  /run/nagios.lock
   Check result directory:  /usr/local/nagios/var/spool/checkresults
           Init directory:  /lib/systemd/system
  Apache conf.d directory:  /etc/apache2/sites-enabled
             Mail program:  /bin/mail
                  Host OS:  linux-gnu
          IOBroker Method:  epoll
 Web Interface Options:
 ------------------------
                 HTML URL:  http://localhost/nagios/
                  CGI URL:  http://localhost/nagios/cgi-bin/
 Traceroute (used by WAP):
Compile the configured Nagios using the below command:
sudo make all
For running the Nagios process, you need nagios user and nagios group.
sudo make install-groups-users
Next, you need to install the Nagios binary log files, service files and sample configuration files.
sudo make install
sudo make install-daemoninit
sudo make install-commandmode
sudo make install-config
Install and configure the apache configuration files as you need Nagios web interface for monitoring of hosts.
sudo make install-webconf
Enable the Apache rewrite and cgi modules.
sudo a2enmod rewrite
sudo a2enmod cgi
To enable third-party access (or external commands), include a separate user to the nagios group.
sudo usermod -a -G nagios www-data
Create a user, nagiosadmin in order to login in to your Nagios web interface using the htpasswd,
sudo htpasswd -c /usr/local/nagios/etc/htpasswd.users nagiosadmin
Note down the password which you enter to secure the nagiosadmin account as you’ll need it later to log into the Nagios interface.
Note: In a case, if you are creating a user by not using the nagiosadmin name, you need to edit the file, /usr/local/nagios/etc/cgi.cfg and replace all the nagiosadmin references with the one you newly create.
Now, restart Apache for the changes to take into effect, using the command:
sudo systemctl restart apache2
You have finished installing Nagios Core, let us now move to install Nagios plug-ins.
Installing Nagios Plug-ins
Step 1: Downloading Plug-ins
Nagios Core works by its dependency plug-ins and therefore, it is a must to install all those plug-ins for Nagios to run properly. Some of the elements monitored by these plug-ins include,
- Current load
- Current users
- Http
- Ping status
- SSH
- Total processes and so forth.
Download the latest Nagios plug-ins using the curl command.
curl -L -O https://nagios-plugins.org/download/nagios-plugins-2.2.1.tar.gz
To install the latest stable version of the plug-ins, go to, https://nagios-plugins.org/
Step 2: Configuring Plug-ins
Extract the Nagios plug-in which you downloaded in the previous step.
tar zxf nagios-plugins-2.2.1.tar.gz
Enter the extracted directory with the below command:
cd nagios-plugins-2.2.1
Now, configure the Nagios plug-in.
./configure
Next, it’s time to install and build the plug-ins.
sudo make
sudo make install
You have done installing the required plug-ins, yet in order to monitor the remote servers, you need to install one more plug-in called check_nrpe.
Installation of check_nrpe Plug-in
Step 1: Installing check_nrpe
Generally, Nagios uses an NRPE plug-in for monitoring of the remote hosts. This NRPE serves via two different parts.
check_nrpe – this is used by the Nagios server
NRPE daemon – this is used by a remote server or web server
Download the latest version of check_nrpe plug-in using the curl command and make sure you are in the Nagios server.
To download the latest stable release of check_nrpe, go to the GitHub page of Nagios https://github.com/NagiosEnterprises/nrpe/releases
curl -L -O https://github.com/NagiosEnterprises/nrpe/releases/download/nrpe-3.2.1/nrpe-3.2.1.tar.gz
Step 2: Configuring check_nrpe
Extract the check_nrpe file which we downloaded in the previous step.
tar zxf nrpe-3.2.1.tar.gz
Next, enter the extracted directory with the command:
cd nrpe-3.2.1
Now, configure the check_nrpe plug-in.
./configure
Post the configuration step, it’s time to install and build the check_nrpe plug-in.
sudo make check_nrpe
sudo make install-plugin
Configuring Nagios
Step 1: Creating Directory
Log into your Nagios server to carry out some of the basic configurations. Open the Nagios configuration file using the below command,
sudo nano /usr/local/nagios/etc/nagios.cfg
After you open the nagios.cfg file, find the below line to make changes,
#cfg_dir=/usr/local/nagios/etc/servers
Uncomment the line as done in the following command,
cfg_dir=/usr/local/nagios/etc/servers
If you want to maintain multiple servers, create the number of files (as needed) using the below directory,
/usr/local/nagios/etc/servers
Step 2: Configuring Nagios Contacts
To configure the nagios contacts use the below command,
sudo nano /usr/local/nagios/etc/objects/contacts.cfg
Replace the email directive’s value with your email address:
define contact{
        contact_name                    nagiosadmin ; Short name of user
        use                             generic-contact ; Inherit default values from generic-contact template (defined above)
        alias                           Nagios Admin ; Full name of user
        email                           your_email@your_domain.com   ; <<***** CHANGE THIS TO YOUR EMAIL ADDRESS ******
Step 3: Defining check_nrpe Command
You need to define the check_nrpe command in the nagios configuration file.
Open the file called /usr/local/nagios/etc/objects/commands.cfg. using the command,
sudo nano /usr/local/nagios/etc/objects/commands.cfg
At the end of the file, include the following commands,
...
define command{
        command_name check_nrpe
        command_line $USER1$/check_nrpe -H $HOSTADDRESS$ -c $ARG1$
}
Note: It is to be noted that here, we have defined the check_nrpe command in the Nagios configuration file.
Now, start Nagios for the changes to take into effect and to restart the Nagios on system start-ups.
sudo systemctl start nagios
To start the Nagios service, use the below command
sudo service nagios start
It’s time to test the working status of Nagios Core as we have successfully installed Nagios and check_nrpe with it’s required plug-ins.
Testing Nagios
Step 1: Accessing Nagios’ Interface
Since you have already configured and created nagiosadmin user id, you can start accessing the Nagios interface by visiting, http://nagios_server_public_ip/nagios
Enter the login credentials of Nagios web interface which you created while configuring the Nagios Core with Apache during the installation process.
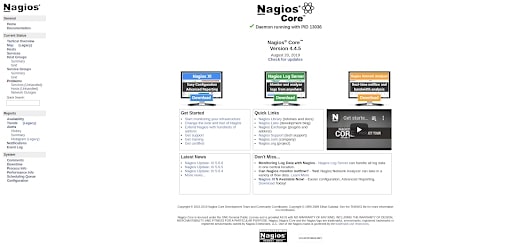
After the successful authentication, you will be able to see the Nagios web interface as shown in the below image.

Step 2: Verifying Nagios (Monitoring) Service
After accessing the Nagios web interface, you need to check whether the Nagios monitors as expected.
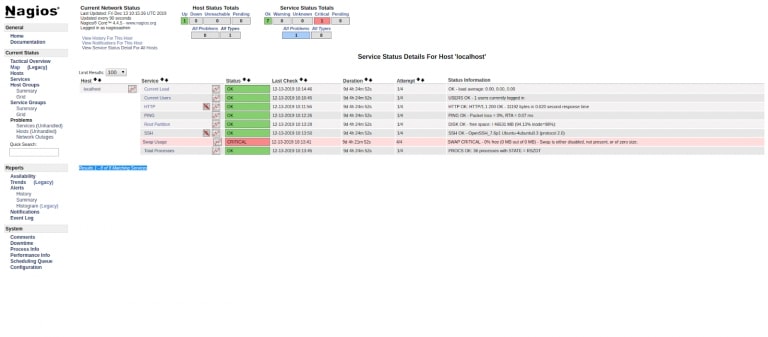
Click the ‘Hosts’ option present at the left-side panel of the Nagios homepage to view the hosts and services which Nagios monitors.

From the above image, it is confirmed that Nagios monitors the ‘localhost’.
Installation of NRPE daemon with its Prerequisites
In this section, you are going to install NRPE Daemon with its required Nagios plug-ins for monitoring of the web server using NRPE (Nagios Remote Plugin Executor). It is to be remembered that the NRPE daemon is a plug-in used by the remote hosts (or servers) and hence, it should be understood that the NRPE daemon will be installed on the remote host.
Log into your web server and create a Nagios user for NRPE agent using the below command.
sudo useradd nagios
Installation of Nagios Plug-ins
Step 1: Updating the Packages
Now, you need to install the NRPE which requires the development libraries as similar to the check_nrpe installation section.
To update the package sources and install NRPE along with its libraries, use the command:
sudo apt update
sudo apt install autoconf gcc libmcrypt-dev make libssl-dev wget dc build-essential gettext
Step 2: Downloading Nagios Plug-ins
NRPE requires the Nagios plug-ins to work properly. Install the Nagios plug-ins from the source and make sure you installed the same plug-ins which you once used to install the Nagios server.
To download the latest stable version of the plug-in bundle, go to nagios-plugins.org/
Download the Nagios plug-ins using the curl command.
curl -L -O https://nagios-plugins.org/download/nagios-plugins-2.2.1.tar.gz
Step 3: Configuring Plug-ins
Extract the Nagios plug-in which you downloaded in the previous step.
tar zxf nagios-plugins-2.2.1.tar.gz
Enter the extracted directory using the below command,
cd nagios-plugins-2.2.1
Next, configure the Nagios plug-in.
./configure
Post configuring the Nagios plug-in, it’s time to install and build the plug-ins.
sudo make
sudo make install
Installation of NRPE daemon
Step 1: Installing NRPE
Install the latest stable version of NRPE daemon using the curl command.
For the latest stable version of NRPE daemon, https://github.com/NagiosEnterprises/nrpe/releases.
curl -L -O https://github.com/NagiosEnterprises/nrpe/releases/download/nrpe-3.2.1/nrpe-3.2.1.tar.gz
Extract the NRPE downloaded file.
tar zxf nrpe-3.2.1.tar.gz
Enter the extracted directory using the below command,
cd nrpe-3.2.1
Step 2: Configuring NRPE
Configure the NRPE using the command:
./configure
Next, build and install NRPE and its startup script using the following commands:
sudo make nrpe
sudo make install-daemon
sudo make install-config
sudo make install-init
Next, check the disk usage and file system to update the Nagios configuration file, using the below command,
df -h /
Post which, you will see an output like below,
Output
Filesystem Size Used Avail Use% Mounted on
/dev/vda1 25G 1.4G 23G 6% /
Now start the NRPE configuration using the following configuration file,
/usr/local/nagios/etc/nrpe.cfg
Open the NRPE configuration file using the below command,
sudo nano /usr/local/nagios/etc/nrpe.cfg
Now, you need to find the following directives in nrpe.cfg file.
server_Address
allowed_hosts
command[check_hda1]
Note:
- Server_Address: You need to set the IP address of your web server you wish to monitor.
- Allowed_Host: Here, add your IP address of the Nagios server.
- Command[check_hda1]: Check the disk
Now, you need to change the filesystem type which you observed in the above sections using the df -h command.
Locate those lines and update the corresponding values.
…
server_address=webserver_ip
...
allowed_hosts=127.0.0.1,::1,your_nagios_server_private_ip
...
command[check_vda1]=/usr/local/nagios/libexec/check_disk -w 20% -c 10% -p /dev/vda1
…
Note: Since the nrpe.cfg file contains lot of attributes, it is better to arrange the above directories as per the ease of identification, to say, at a single place in the file.
Step 3: Restarting NRPE
Once you complete doing the above changes, restart the NRPE service using below command,
sudo systemctl start nrpe.service
To verify the NRPE service, use the command:
sudo systemctl status nrpe.service
For which you’ll get an output like below,
Output
...
Aug 01 06:28:31 client systemd[1]: Started Nagios Remote Plugin Executor.
Aug 01 06:28:31 client nrpe[8021]: Starting up daemon
Aug 01 06:28:31 client nrpe[8021]: Server listening on 0.0.0.0 port 5666.
Aug 01 06:28:31 client nrpe[8021]: Server listening on :: port 5666.
Aug 01 06:28:31 client nrpe[8021]: Listening for connections on port 5666
Aug 01 06:28:31 client nrpe[8021]: Allowing connections from: 127.0.0.1,::1,192.168.2.17
Step 4: Enabling Firewall
To ensure a secure connection, you need to use UFW. For that, you need to allow the NRPE service port number in the firewall. The port number of NRPE is 5666.
sudo ufw allow 5666/tcp
Note: In case, if you want to monitor more hosts, follow the above nrpe.cfg file and create multiple files using those directories. After the successful configuration of NRPE, you need to add the same host details in the Nagios server before you check to access the Nagios web interface.
Step 5: Verifying the Connection Between the Servers
Now, you need to confirm whether the Nagios server and web server do possess the communication. To confirm, make sure you logged into Nagios server,
/usr/local/nagios/libexec/check_nrpe -H webserver_ip
You’ll see the following output:
Output
NRPE v3.2.1
Monitoring Configuration with Nagios Server
Step 1: Creating Files
Here, you need to define the host and service details for the host which you going to monitor.
You need to create a separate file for each host and eventually add the host details on the Nagios web interface.
Create a separate file for each of the hosts in the following directory.
cd /usr/local/nagios/etc/servers/
Next, create a new file using your remote server’s domain name.
sudo nano /usr/local/nagios/etc/servers/remote_host_name.cfg
Step 2: Defining Hosts
After creating the file, add and define the host and service details for your remote host, using the remote_host_name.cfg file.
define host {
use linux-server
host_name remote_host_name
alias My client server
address remote_host_ip_address
max_check_attempts 5
check_period 24x7
notification_interval 30
notification_period 24x7
}
In this code, you need to update the values of host_name, alias and address.
host_name is the domain name of your remote server which you going to monitor,
alias is the name for identification purposes and finally,
address is the IP address of your remote server.
Step 3: Adding Additional Services
Here, add the following services such as Load Average, Disk Usage, CPU Load, Total Processes and Current Users in your remote_host_name.cfg file.
Add the services after your Host Section using the below file,
sudo nano /usr/local/nagios/etc/servers/remote_host_name.cfg
#Host Section
define host {
use linux-server
host_name remote_host_name
alias My client server
address remote_host_ip_address
max_check_attempts 5
check_period 24x7
notification_interval 30
notification_period 24x7
}
#Add the Load Average service
define service {
use generic-service
host_name remote_host_name
service_description Load average
check_command check_nrpe!check_load
}
#Add the Disk Usage service
define service {
use generic-service
host_name remote_host_name
service_description /dev/vda1 free space
check_command check_nrpe!check_vda1
}
#Add the CPU Load service
define service {
use generic-service
host_name remote_host_name
service_description CPU Load
check_command check_nrpe!check_load
}
#Add the Total Process service
define service {
use generic-service
host_name remote_host_name
service_description Total Processes
check_command check_nrpe!check_total_procs
}
#Add the Current Users service
define service {
use generic-service
host_name remote_host_name
service_description Current Users
check_command check_nrpe!check_users
}
Step 4: Testing the Nagios Host
After adding the above services, you need to restart the Nagios service using the following command,
sudo systemctl restart nagios

Next, go to the Nagios web interface and click ‘Hosts’ presents at the left-side panel of your Nagios dashboard.
Post which, you will able to see the host and other services which you are already included in the previous sections.